| 01 Introduction |
02 Physical experiments |
03 Digital tools |
04 Process |
05 Results |
06 Evaluation |
07 Physical models |
08 Conclusions |
| Slender multistress driven structures Guillem Baraut Mattia Gambardella |
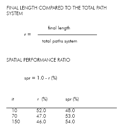
| SLENDERNESS CRITERIA The classical definition of slenderness describes the ratio of an objectís height to its width, but itís independent of load. Frei Otto defined a new type of slenderness that considers this: where l is the slenderness of the structure, and s is the distance of transfer of the force F. This load is considered as a two dimensional value, being the load applied in a certain area. The distance s is a one dimensional value, thus Frei Otto defined the slenderness with the square root of the force, and the resultant slenderness is non dependent of the absolute dimensions. This means that as happens with the geometrical slenderness, the slenderness of a structure will be the same for the structure itself, and for the model of this structure. In order to measure the load bearing capacity of a structure Frei Otto introduced the variable Tra as: In the widest sense Tra is a measure for the ability of an object to transfer forces. Because of it is not always possible to define a clear value of Tra, Frei Otto introduced the concepts of maximum Tra, deformation Tra, dead load Tra, live load Tra, etc. He used this variable to classify structural forms, and to compare the efficiency of different systems by means of numerical values. Neither slenderness nor Tra provide any information about the crucial criterion for lightweight construction, that can be a reference to the mass of this construction. For that reason he defined a new variable called BIC: This variable is a characteristic of lightweight structure since defines a relationship between a structureís mass m and its ability to transfer loads Tra into its supports. The second image illustrates the relation BIC-lambda for several bridges that were calculated in the Institute for Lightweight Structures. Because of the large differences between the values the diagram is done with logarithmic scales. All these variables and the diagram will be used later on to compare the results of the whole process explained in this dissertation with real existing structures. From the chart of the Institute for Lightweight Structures we see that the final design (with variables in first image) coincides with some of the first cable stayed bridges of the 60's. This is still a bit far away form the most slender suspended bridges, but this was one of the first results of the method. Adjusting some parametres this result can be improved. |
|
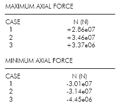
| STRUCTURAL ANALYSIS The structural performance evaluation consists in an elastic static analysis using a professional finite elements analysis software, Ansys. The results are used in order to define the dimensions of the structural elements. In other words, the amount of fibers that are necessary for every strand are defined. Three cases are analysed and compared, for which of them some variables are changed. The variables are mainly the distribution of fibers (regular or irregular), and the structural connectivity when a cross occurs between two paths. This cross can just be in terms of circulation but the structure can still be completely detached, or completely connected. In figures 1 and 2 there are two simple examples of a regular distribution of fibers in the first one, and an irregular in the second image. The irregular distribution means that the fibers donít follow a regular pattern, but they still follow the angles defined by the vector field. In the following pages there is the comparison between three cases: 1. Even distribution of fibers without structural connection between the several paths 2. Irregular distribution of fibers with structural connection between the several paths 3. Even distribution of fibers with structural connection between the several paths In all the analysis we will see that the third one is always the best solution. For all cases the amount of material that is used is exactly the same, the same profiles and transverse sections for every fiber path. The maximum vertical displacement occurs in the first two cases at the center of the longest span, while for the third case this is in one of the shortest ones. The value is reduced by ten at the last case. This structural connectivity can be related to the biomimetic principles explained at the first chapters of this study. The redundancy in the structure can be achieved with exactly the same amount of material, it is a matter of how connected are the fibers. This is a clear example of how this extra connectivity, a local change, can improve a lot the global behaviour of the system. The same behaviour can be observed when comparing the axial forces on each element. On the third case the maximum compression and tension forces are reduced by ten. The structural behaviour is then gaining benefits from the redundancy in connectivity in both maximum stresses and maximum deflection. |
|
 |


